Predixion Insight For Excel provides some excellent sampling tools that can be applied to data in Excel worksheets or in an embedded PowerPivot database. If you believe that there are any analysis opportunities outside of pivot tables, sampling PowerPivot becomes very interesting. Since very few tools outside of Predixion Insight can read PowerPivot data directly and you simply cannot move over 1 million rows from PowerPivot into an Excel worksheet, you are pretty much stuck if you want to perform varied analyses on that PowerPivot data. By sampling PowerPivot data you can leverage any techniques that you know and love in native Excel for analysis as well as using any other analytical addins such as the
Microsoft Solver Foundation.
Predixion Insight offers three kinds of sampling – percentage, row count, and balanced. Percentage sampling allows you to specify a specific percentage and will produce a random sample with approximately that percentage of data rows from the source table. Row count will produce a sample containing exactly the number of rows you request (assuming there are that many in the source table to begin with). Balanced sampling is a special case since the purpose isn’t to reduce data volume, rather it is to accentuate a typically rare feature of the data for better pattern discovery – e.g. increase the balance of rows representing fraudulent vs non fraudulent cases. Independent of the sampling type, the resulting sampled set can be created as a table in an Excel worksheet or in PowerPivot (ProTip: in a pinch, using Predixion Insight sampling is a great trick to move data back and forth between the two).
However, when you have transactional data, you really need to think about sampling a little differently. In transactional data, information about a single transaction is contained across multiple rows. Sampling individual rows would actually break up a transaction and change the nature of the data itself. For example, a 20% sample of shopping cart data essential removes 8 items out of a 10 item basket – you would be very unlikely to find the mythical beer and diapers correlation that way! Instead you need a way to sample that would take an entire transaction rather than individual rows.
In order to accomplish this, you need Excel and PowerPivot (obviously) as well as Predixion Insight for Excel and the source database from which you pull your transactional data.
I’ll go through the entire sequence explicitly, but here are the high level steps:
- Load transactional data into PowerPivot
- Load distinct transactional id’s into PowerPivot
- Create a sample of the transactional keys
- Add a relationship to PowerPivot between the full data table and the sample
- Add a calculated column indicating rows that are selected
- Use that column as a table filter
In this example, I’m using some data from Last.FM regarding music artists and user submitted tags that I pulled from
here.
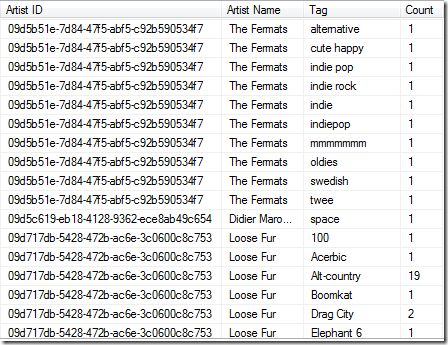
You can see that the data is “transactional” with the “Artist ID” being the transaction ID with the “Tag” being the items in the transactions.
First get the data into PowerPivot by opening the PowerPivot window from Excel and selecting “From Database/From SQL Server” from the ribbon. (If your data is in a different database, find it under “from other sources”)
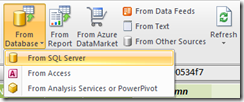
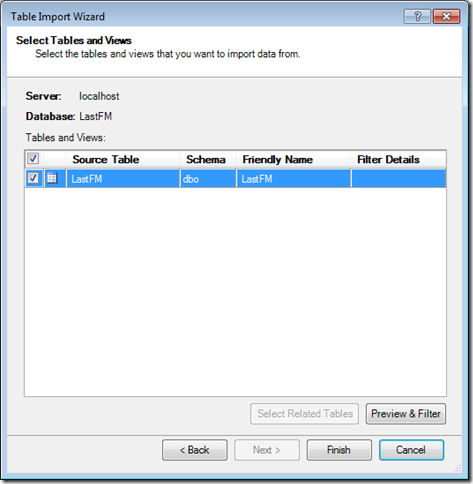
This launches the table import wizard where you indicate the location and database containing the data to load, and then select the transactional table.
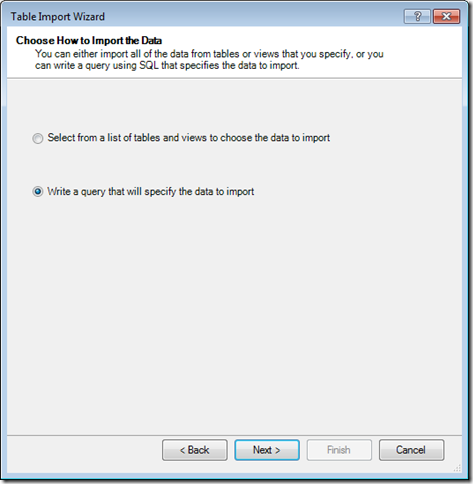
Next go back to the Table Import Wizard, but this time, select the “Write a query” option
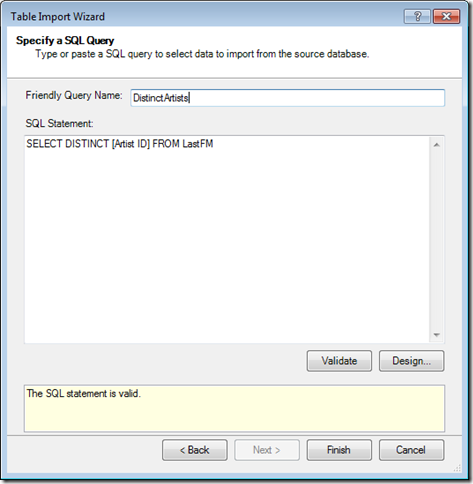
The query is a simple “SELECT DISTINCT” of the transaction ID’s. Note that the “Friendly Query Name” will end up as the table name in PowerPivot so it’s a good idea to set it here.
Then you go back to Excel, switch to the Insight Analytics ribbon and choose the “Sample Data” tool

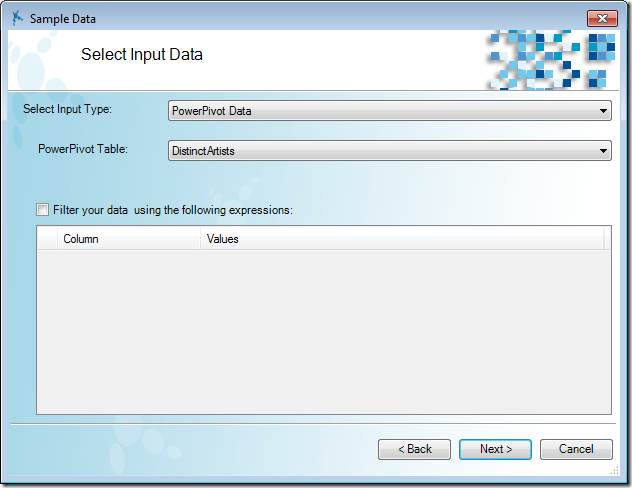
Select “PowerPivot Data” as the input type and choose the result of the select distinct query as the table.
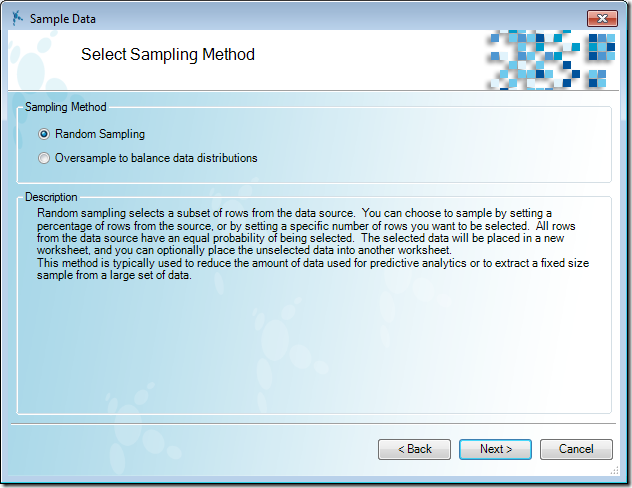
Choose the sampling method – in this case you will want to choose Random Sampling to reduce data volumes.
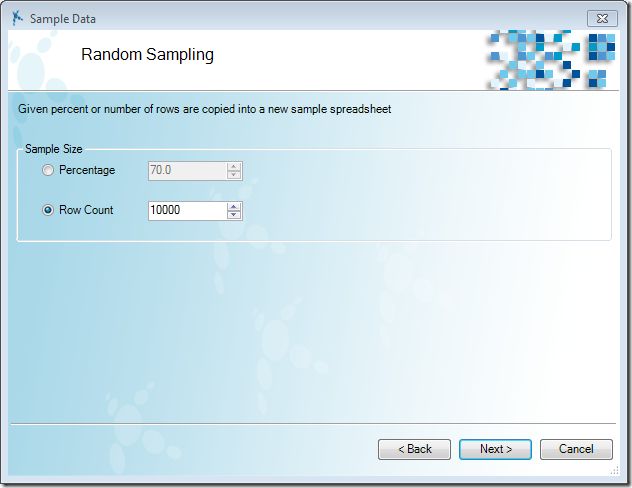
Then choose how many transactions you want in the output. This is entirely up to you at this point. For this example, I chose 10,000 transactions, but really it’s whatever you choose to be right for your scenario.
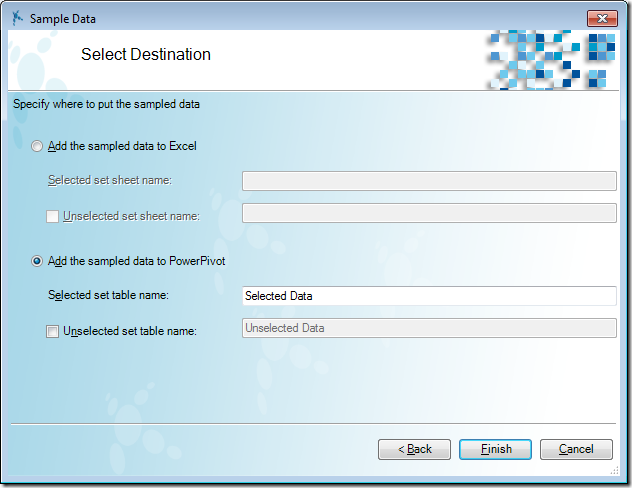
Finally, specify where you want the results – you need to add the results as a PowerPivot table, but you can change the name. There’s no point in creating an unselected list as you will see later in the example.
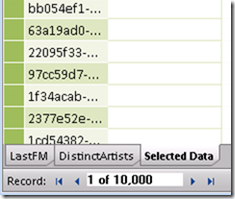
When the sampling is complete you can open PowerPivot, switch to the sampled data page and see how many transactions you selected. Since I chose 10,000 for this example, there are exactly 10,000 transaction ID’s in the result!
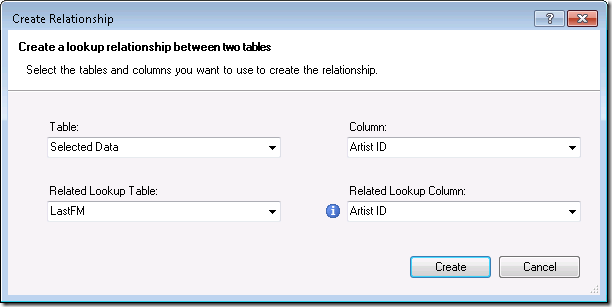
Now you need to create a relationship between the Selected Data table and the source table – in my example, that’s the LastFM table. First, in the PowerPivot window, switch to the Design ribbon and click “Create Relationship.”

In the Create Relationship dialog, relate the transaction ID from the Selected Data table to the transaction ID of the full transaction table.
Next you need to add a calculated column to the full transaction table indicating for each row if that row has been selected or not. There are many DAX expressions that will work to do this, I chose the straightforward “not blank related” approach.

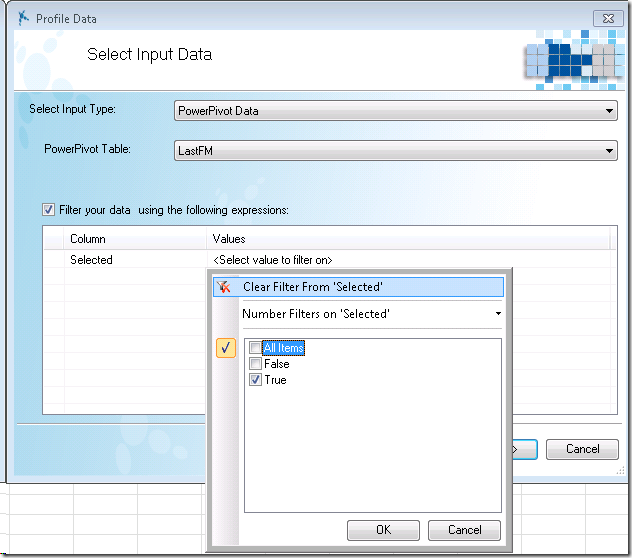
And that’s it! You now have a sampled a transactional table – or at least labeled rows in a transactional table in such a way that you can easily select the sampled transactions. In Predixion Insight for Excel, you can always filter a PowerPivot data source for any operation using the filter control on the data selection page. Also, this is why you don’t need to keep the “unselected” samples since you can easily choose either the “selected” items or the “unselected” items in any filter.
Let me finish this off with one more ProTip. It’s unlikely that you will want these extra tables – i.e. the distinct list and sampled list of transaction ids – to show up in your pivot table analyses. While you can’t explicitly hide
tables in PowerPivot, if you hide
all the columns in a PowerPivot table it has the same effect. So to effectively hide a table from pivot charts, go to the Design ribbon in PowerPivot and use the Hide and Unhide tool to hide all of the columns in the extra tables.
