Friday, May 20, 2011

Scoring R models against PowerPivot Data–Part 2–Creating an R classification model

This is part 2 of a three part series about integrating R and PowerPivot.

  • Part 1 – Intro (includes links to necessary components)
  • Part 2 – Creating a classification model in R
  • Part 3 – Evaluating and Scoring R models in Predixion

In this installment, I’m going to walk through the process of creating a predictive model in R, exporting the model as PMML and importing the model into Predixion Insight.  The demo requires packages from Togaware to create models and export them– you can go to the Togaware website and follow their instructions, or you can just launch the R console and enter:

> install.packages("RGtk2") 
> install.packages("rattle", dependencies=TRUE)


Now, you may be prompted to install additional packages and you may have to restart R after the library installation is complete – it’s probably a safe bet in any case.


After you’ve installed R and the correct libraries and are in the correct state of R preparedness, you can load the necessary libraries into R using these commands:


> library(rpart)
> library(pmml)


The next step is to load the training dataset into R.  As preparation for this article, I created a model (the same model as in our demo video) and used the technique in my previous post (for those who already read that, this was the point) to export the training set and saved the result as a .csv file.  I’ve put the training data file up on my SkyDrive if you just want to grab it.


This line reads the.csv file and puts the result into an object called “insurance”.  Note that R, due to it’s UNIX origins, uses forward slashes instead of backslashes as directory separators – also it’s case sensitive!


> insurance <- read.csv("Data/Insurance Demo/insurance.train.csv")


Next, I need to create a predictive model.  The rpart command creates a tree model on a dataset given a target column.  There are many additional parameters controlling how the tree is created, but for the purposes of this blog post, I’m just providing the shortest possible command.  This line creates a tree model and places it into an object called “TreeModel” that we can use later


> TreeModel <- rpart(Converted~.,insurance)


The pmml command converts the tree model to PMML, assigning the result to “TreePmml”.


> TreePmml<-pmml(TreeModel)


Finally, use write to output the pmml into a file – note again the forward slashes in the file path!


> write(toString(TreePmml),"Data/Insurance Demo/RModel.pmml")


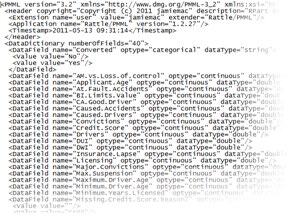
This creates the file “RModel.pmml” that, if you’re curious, you can open up and examine in notepad or any other text editor.  Inspecting the text you’ll see that PMML is simply an XML representation of the patterns that were learned by the R algorithm – if you search for the word “node” you will find the structure of the tree itself.


image


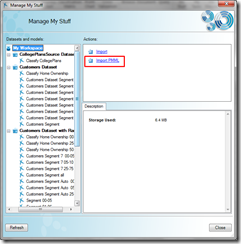
Now that I have a model in PMML, I can launch Excel with Predixion Insight for Excel installed, switch to the Insight Analytics ribbon and click the My Stuff button.  In the My Stuff dialog, I need to click “Import PMML” to load the R model.  Note that PMML support is available in the Predixion Insight Free Trial and the Predixion Insight with PMML products.


image_thumb_thumb


image_thumb1_thumb


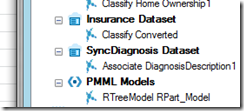
After I click Import PMML and select and import my R model, it appears in the list of datasets and models under a special PMML node in all dialogs where you select a model, such as the My Stuff dialog or the accuracy chart and query wizards.  For most purposes PMML models are treated the same as native Predixion models in that you can import and export them, share them with other users, and publish them to shared collections.


image_thumb2_thumb


In the next installment, I will show you how to use the R model in Predixion to generate accuracy charts, and, as promised, score data in PowerPivot!
Wednesday, May 18, 2011

Scoring R models against PowerPivot Data - Part 1 of 3–Introduction

This series is all about combining two completely different technologies that target two completely different audiences.   However, it turns out that those two audiences often have to serve the same master in looking for information and insight within their data.  And typically those two audiences don’t or can’t talk to each other, which makes driving common goals a bit difficult.

PowerPivot is a tool for preparing and creating data applications from a business analyst’s perspective.  You can bring data in from multiple sources, match them together, derive new information, create some calculations, and present the results in an attractive and meaningful business context.  You can download and find more information about PowerPivot at www.powerpivot.com.  Go ahead – it’s free!

R is a statistical language for preparing and creating data applications from a data scientist’s perspective.  You can import data, apply statistical tests and analysis, derive new information, and visualize the results in a scientific and statistical context.  You can download and find more information about R from www.r-project.org.  Go ahead – it’s free!

So the question remains, how can we make these two worlds collide in a meaningful way that takes the science performed in R and applies it to the business context of PowerPivot.  You knew I was going to say this, but Predixion Insight is the way!  Predixion Insight and Predixion Insight for Excel allows you to take predictive models created in R and apply them to data in PowerPivot (and Excel actually), thereby taking the scientific abstracts and providing them concrete business context.

In this three part series, I’m going to walk through the complete process of creating a model in R and then applying it to data in PowerPivot by means of Predixion Insight.  The four parts will cover the following topics:

  • Part 1 – Intro (you’re reading this now)
  • Part 2 – Creating a classification model in R
  • Part 3 – Evaluating and Scoring R models in Predixion

Friday, May 13, 2011

Querying the Training and Testing Sets

This article (as you could rather clearly surmise from the title) is about querying the training and testing sets of a Predixion Insight model.  This is a very useful technique and is handy in a variety of situations, but that is not the point of this article.  The point of this article will be revealed in a future posting, so for now you can sit back and learn how to retrieve training and testing sets.

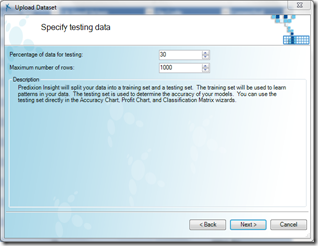
Whenever you upload a rectangular dataset using Predixion Insight you have the option to automatically separate your data into training and testing sets.  The page of the wizard where you specify this information looks like this:

image

The parameters allow you to control how much data is set aside for testing up to a maximum.  Later this held out data is used to automatically create accuracy charts, profit charts and other fun stuff.

Once your data is uploaded to Predixion Insight, you can create as many models as you wish on the dataset with ease using any of the modeling tools or even visual macros for automation.  If, for any reason, you want to fetch the data from the Predixion Insight server back into your Excel workbook or PowerPivot table, you can use the Query tool on the Insight Analytics ribbon.

image

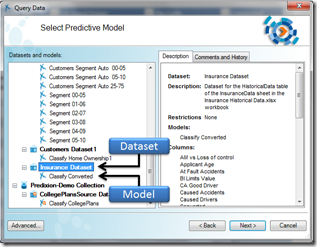
In the Query Wizard you select a dataset to query rather than a model.  Querying a model generally means fetching predictions or model patterns.  Querying a dataset simply means fetching the data that is cached in that dataset.

image

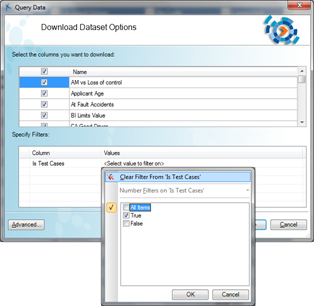
On the next page of the wizard you select which columns you want to fetch from the dataset.  You can click the checkbox at the top to retrieve all of them.  More importantly you can select a filter to limit which rows are returned.  This is where the magic comes in – there is a “special” filter clause that you can select called “Is Test Cases”.  Setting this filter clause to “true” causes only the test cases to be returned, whereas setting the clause to “false” returns only training cases.

image

And that’s it.  Although you now may have a new trick in handling your Predixion Insight datasets, you will have to wait until a future installment to learn why this detail is so important.  Until then – happy mining!